CHARTS & GRAPHS
$10/month OR $110/year

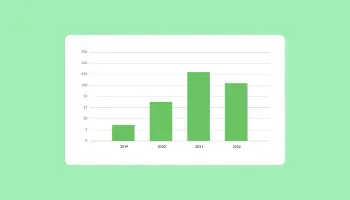
This interactive chart visualizes data trends over the years, helping you easily compare values and identify patterns. Use it to gain insights and make informed decisions based on the presented information.
Widgeting 101: Your Burning Questions Answered
What does the Charts widget do?
Displays data in bar, pie, and line charts.Can I import data?
Yes, via CSV or manual entry.Is styling flexible?
Fully customizable.

